
NEXUS TASC MODULE
(Thermal Analysis by Structural Characterisation)
Linkam and Cyversa have developed in partnership a revolutionary thermal technique to provide characterisation scientists with a powerful tool for analysing materials.
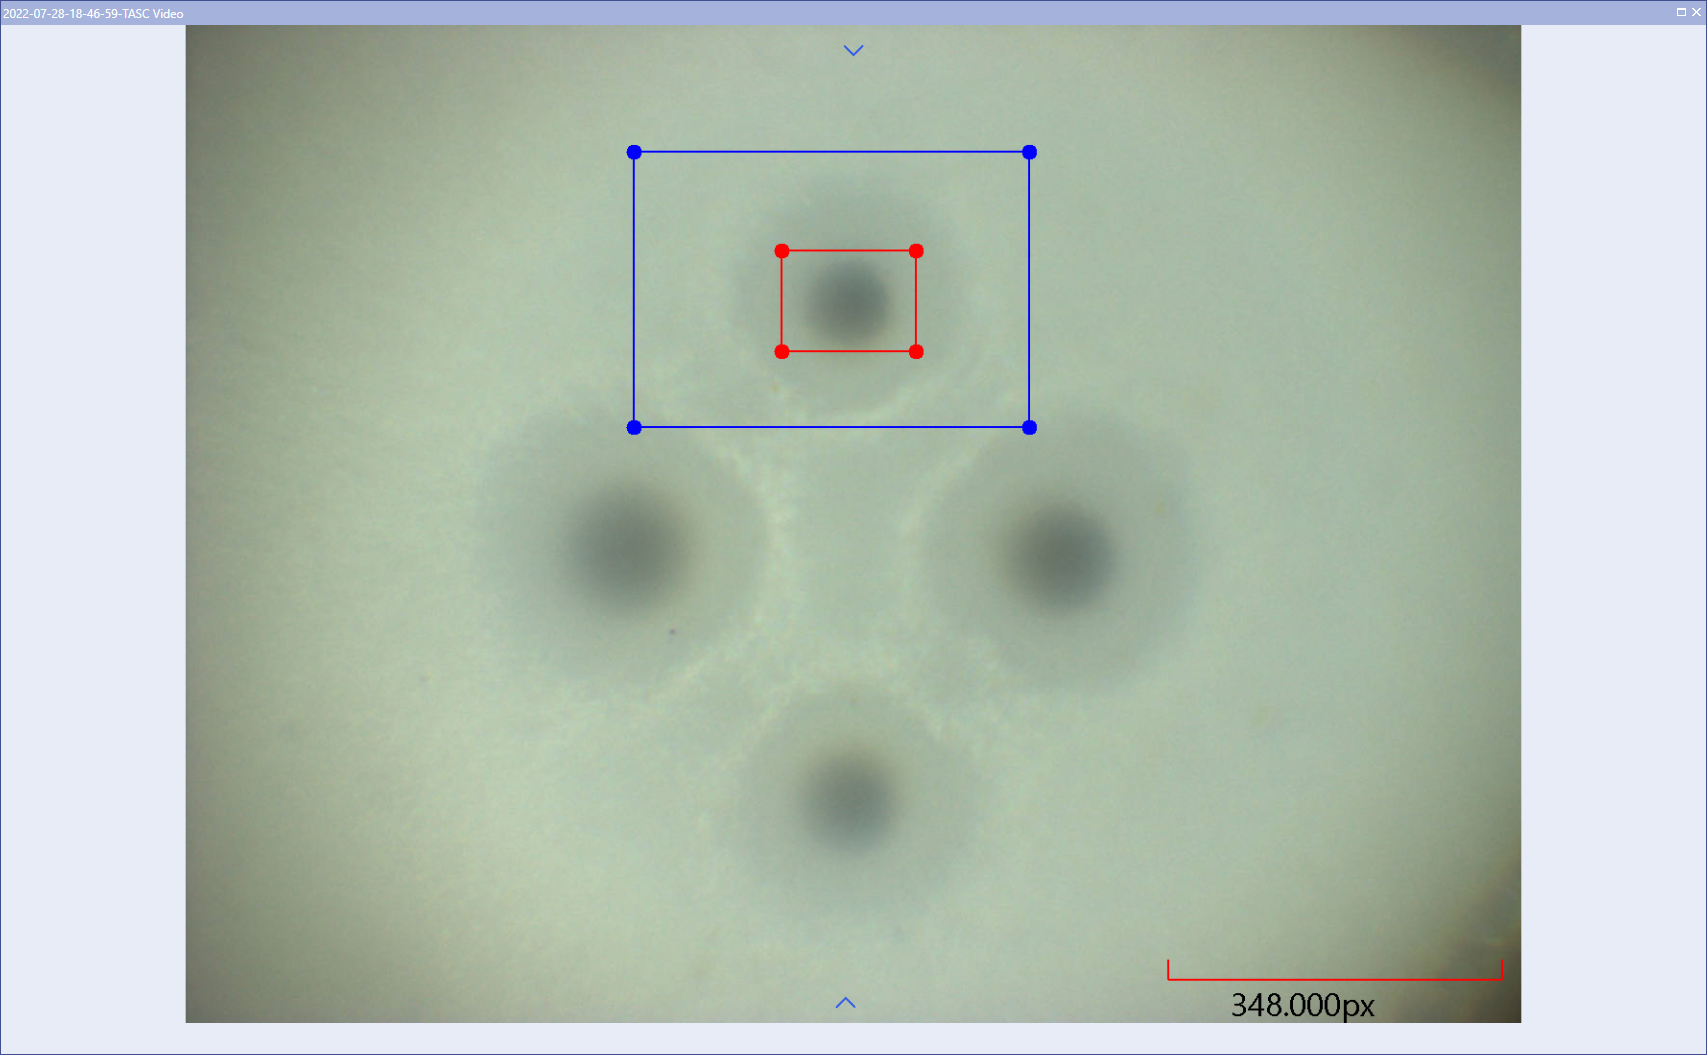
TASC area of interest defined on the first of a series of images

Resulting TASC data calculated and displayed with temperature against time
Key features include:
Turn your temperature control microscope stage into a thermal analysis laboratory capable of measuring glass and melting transitions in many different materials including opaque samples.
More sensitive than DSC at low heating rates and for small samples.
Kinetic parameters over a wider range of heating rates than any conventional method.
Local thermal analysis.

A new image analysis algorithm enables structural changes in any sample to be tracked and quantified. The image above shows the position of the selected structural feature (the blue apex of the 3D plot). The height characterises changes in that structure.

The plot above compares a TASC result with a DSC measurement of a glass transition at 20°C/min. Both detect the transition, but the DSC signal degrades at slow heating rates and small sample sizes. DSC can only provide averaged information and cannot detect differences between different parts of a sample.

The plot above is a TASC result for the glass transition of a drug at 0.02°C/min; at this heating rate the DSC signal is just noise.
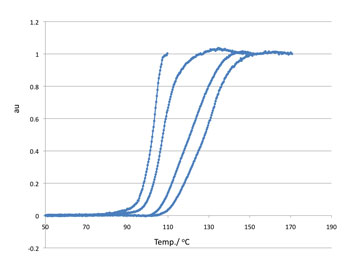
The plot above shows results at a range of heating rates from 0.1°C/min to 100°C/min, a broader range than that of any conventional method.
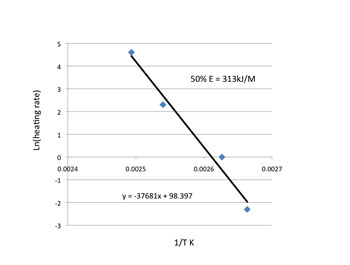
From these data kinetic parameters such as apparent activation energy can be determined that are related to, for example, drug stability.

Above a TASC measurement detects a glass transition in less than 10 micrograms of sample.

Above you see an optical image showing two regions.
TASC has the unique ability to measure local transition temperatures. In this way different points on a sample can be identified.
The TASC graphs show transitions at 78°C and 110°C in two different regions.
Please contact us for more information.
This article in American Laboratory details the advantages of this technique, with specific reference to its application in the analysis of polymer blends for drug delivery.